Client Published Papers:
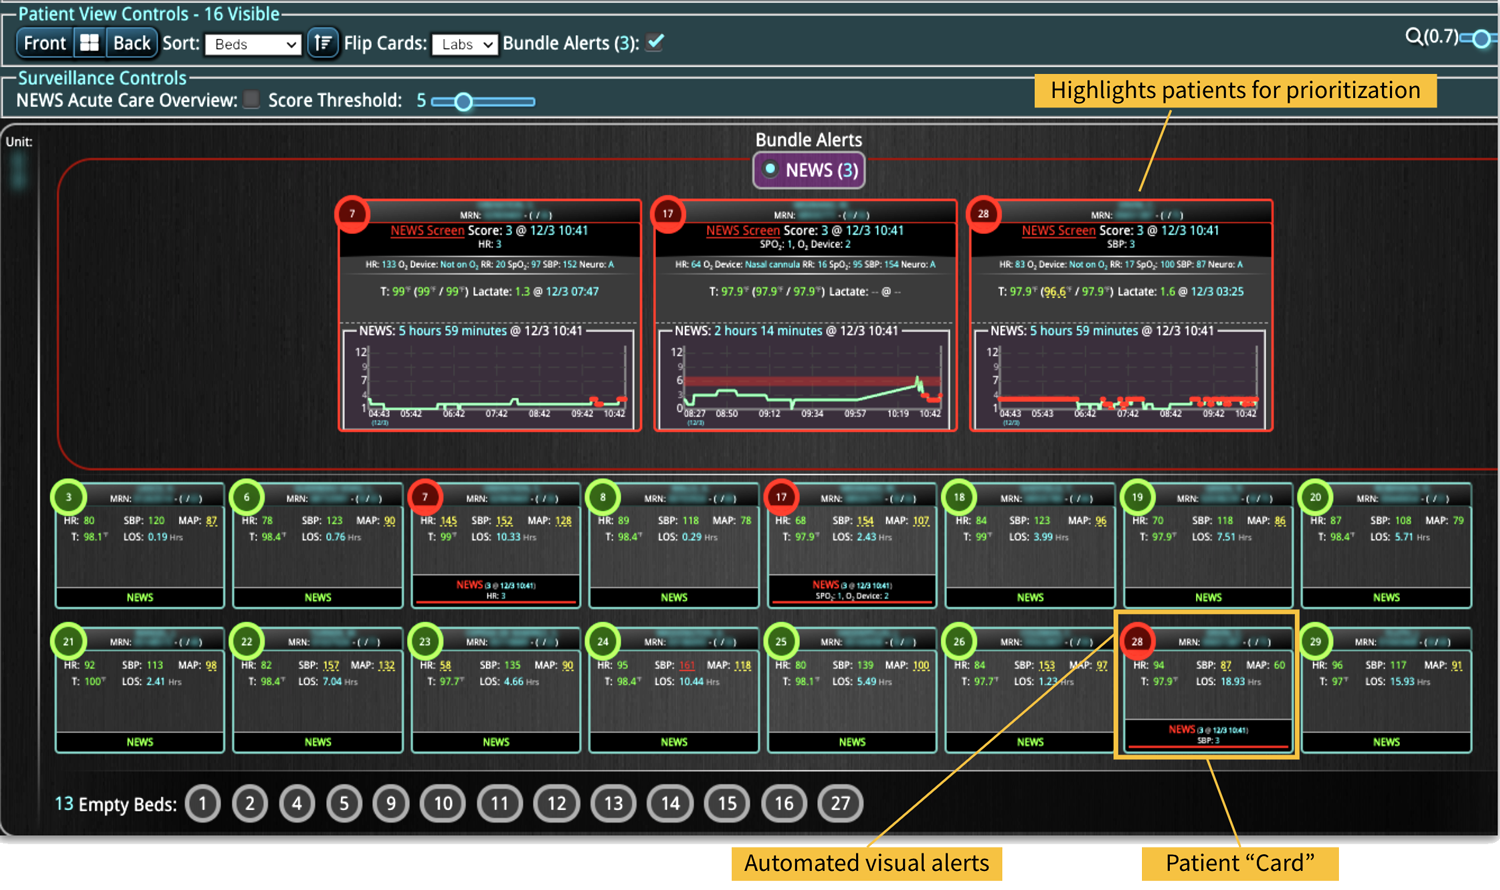
P1. Morgan CK et.al. Continuous Cloud-Based Early Warning Score Surveillance to Improve the Safety of Acutely Ill Hospitalized Patients; J Healthc Qual. 2021.
P2. Howard C, et. al. Implementation of automated early warning decision support to detect acute decompensation in the emergency department improves hospital mortality. BMJ Open Qual. 2022.
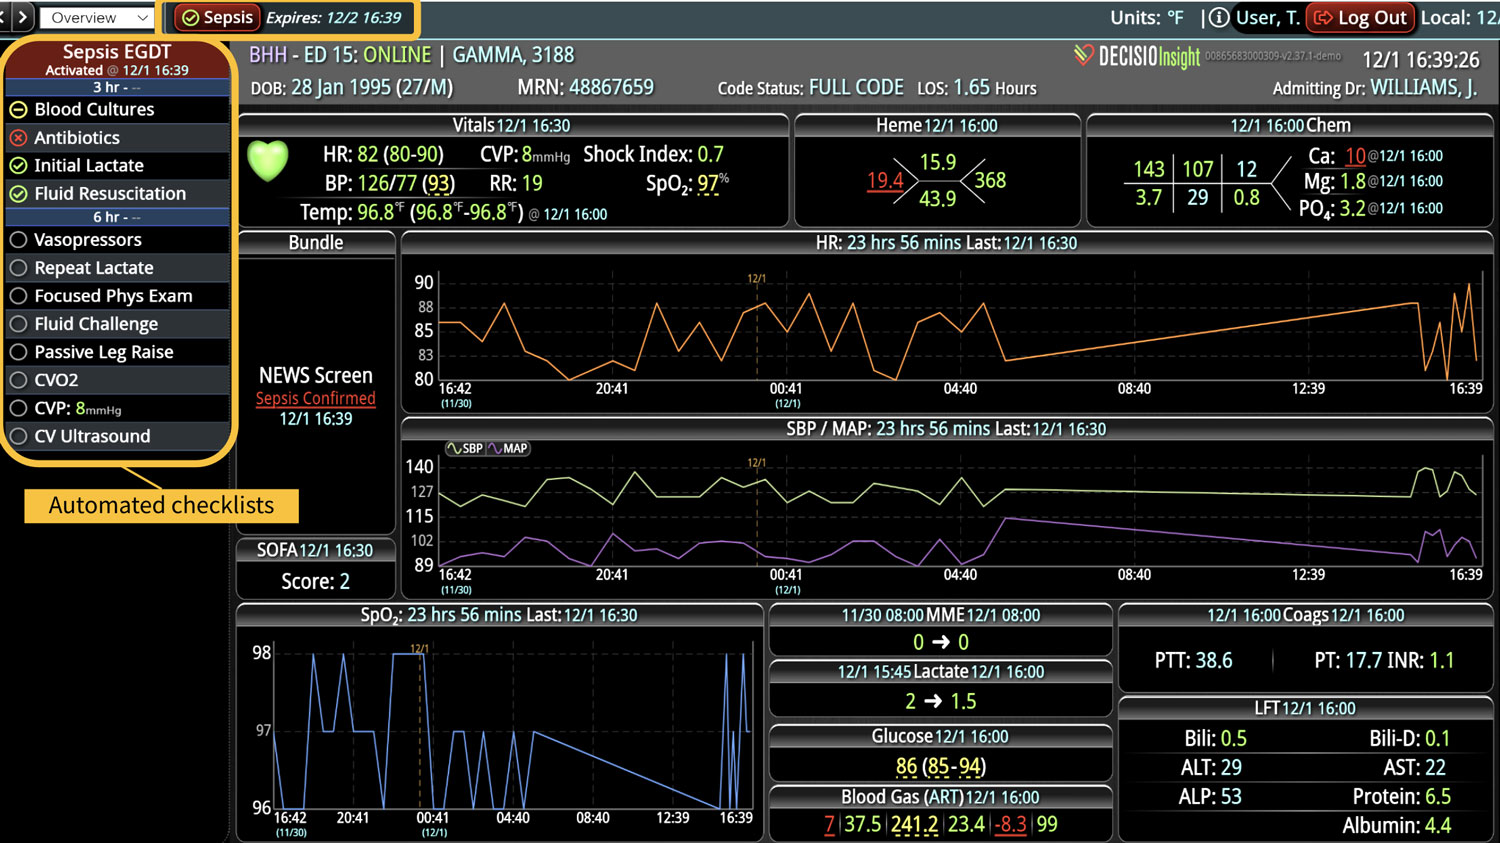
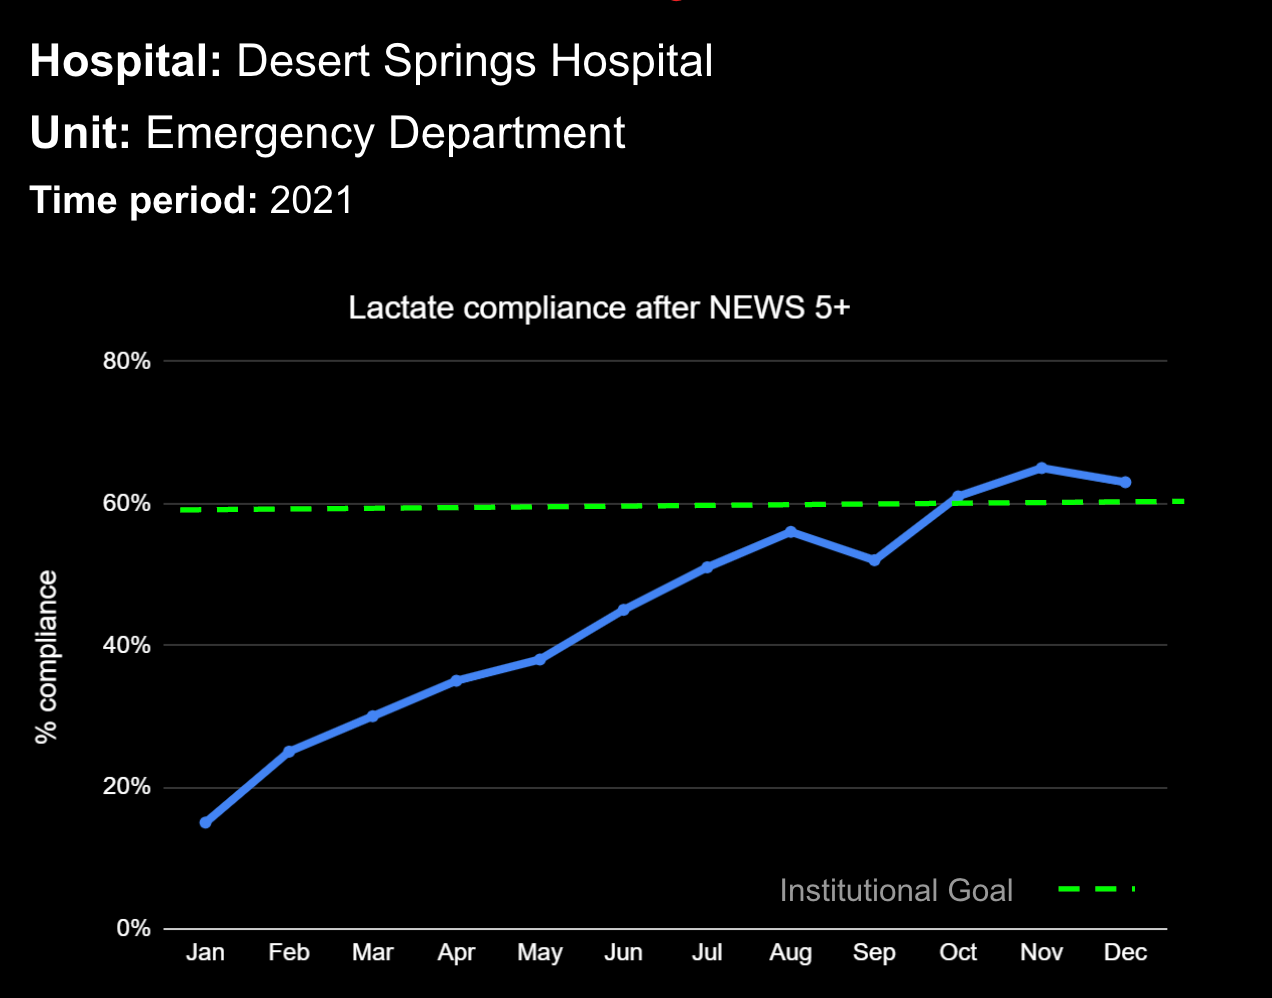
P3. Jung AD, et al. Sooner is better: use of a real-time automated bedside dashboard improves sepsis care. Journal of Surgical Research. 2018.
Client Published Abstracts:
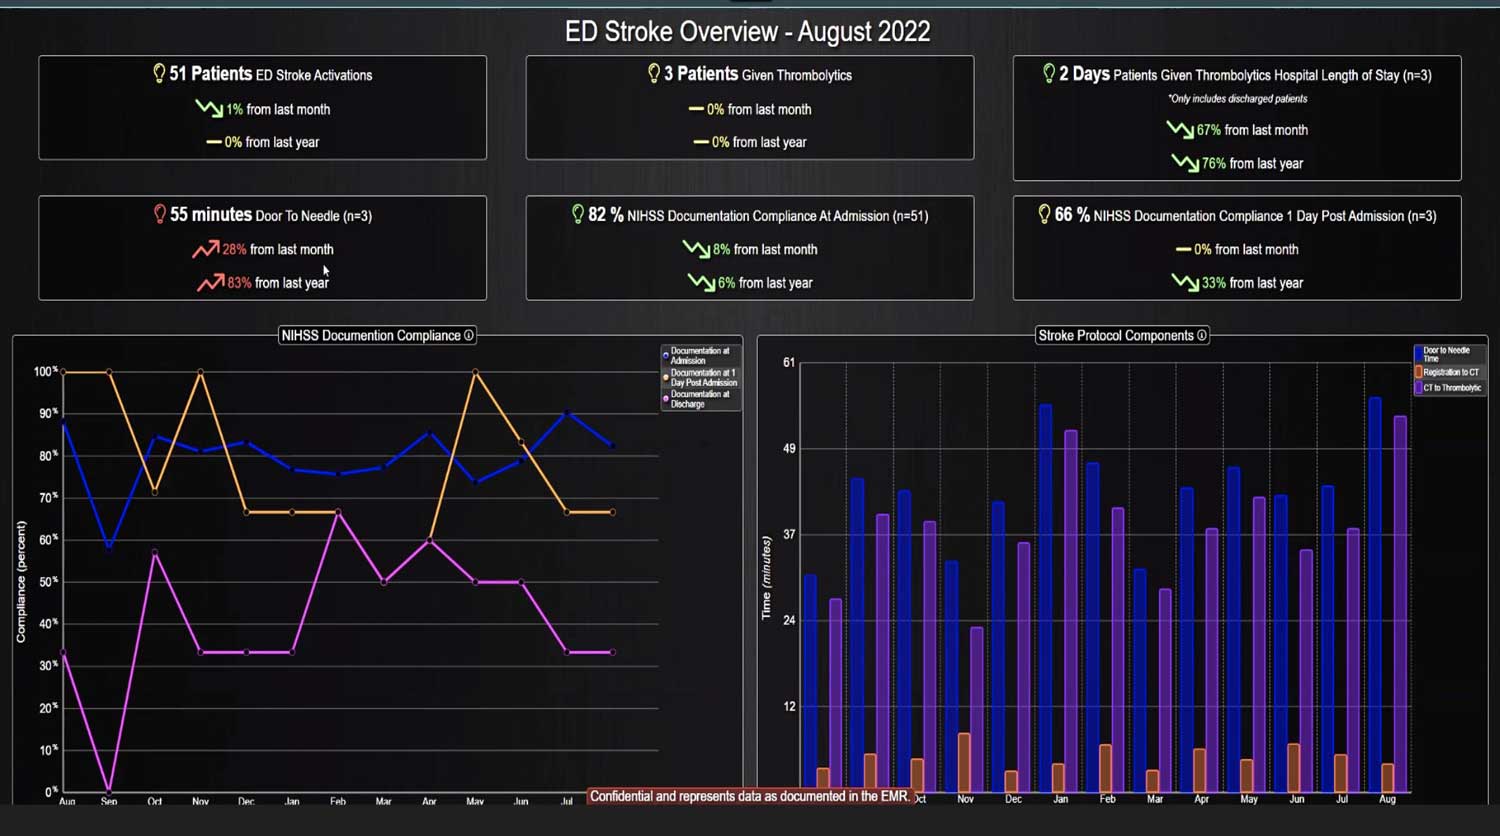
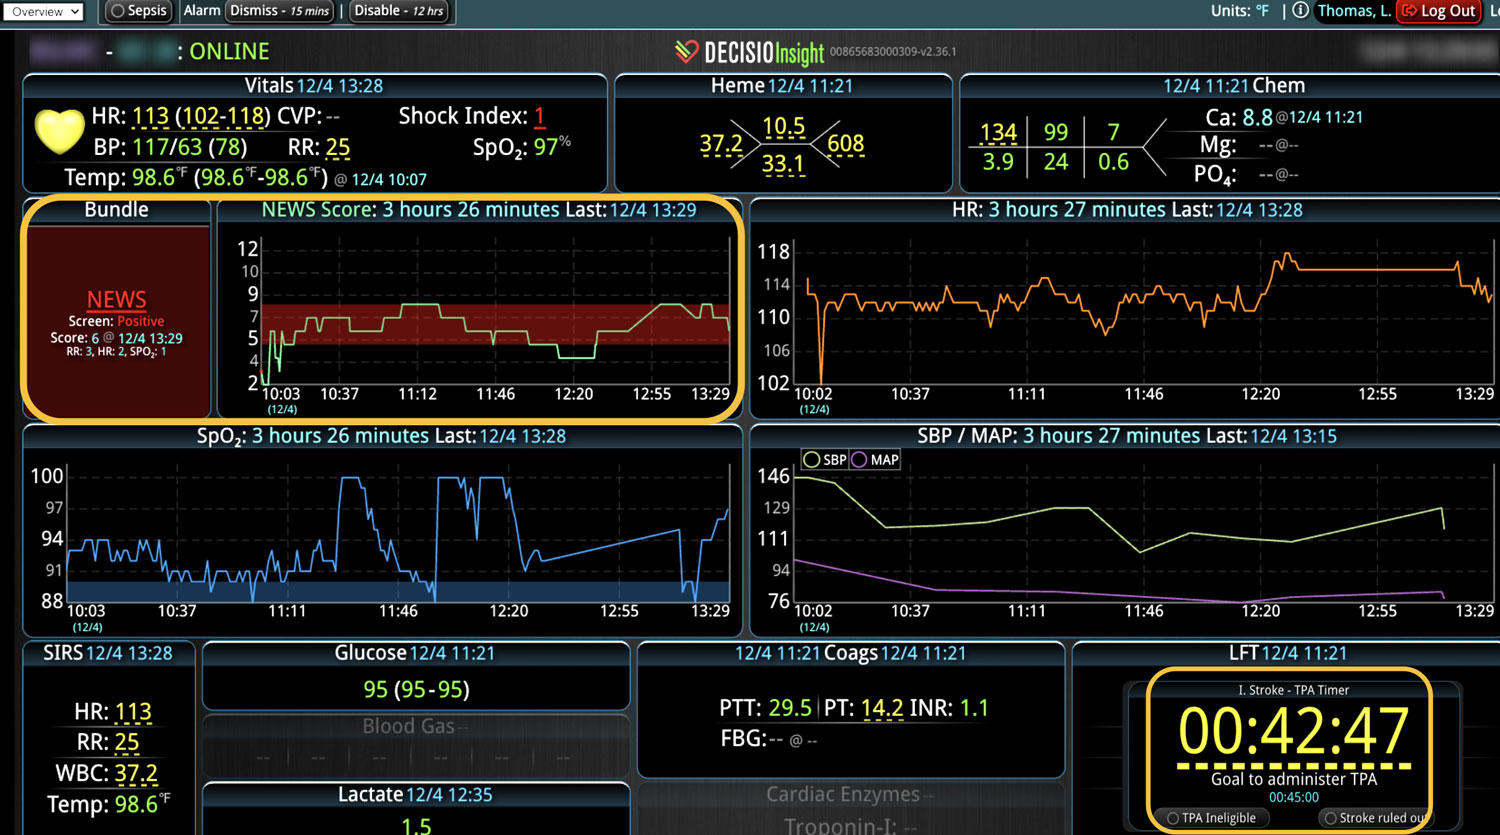
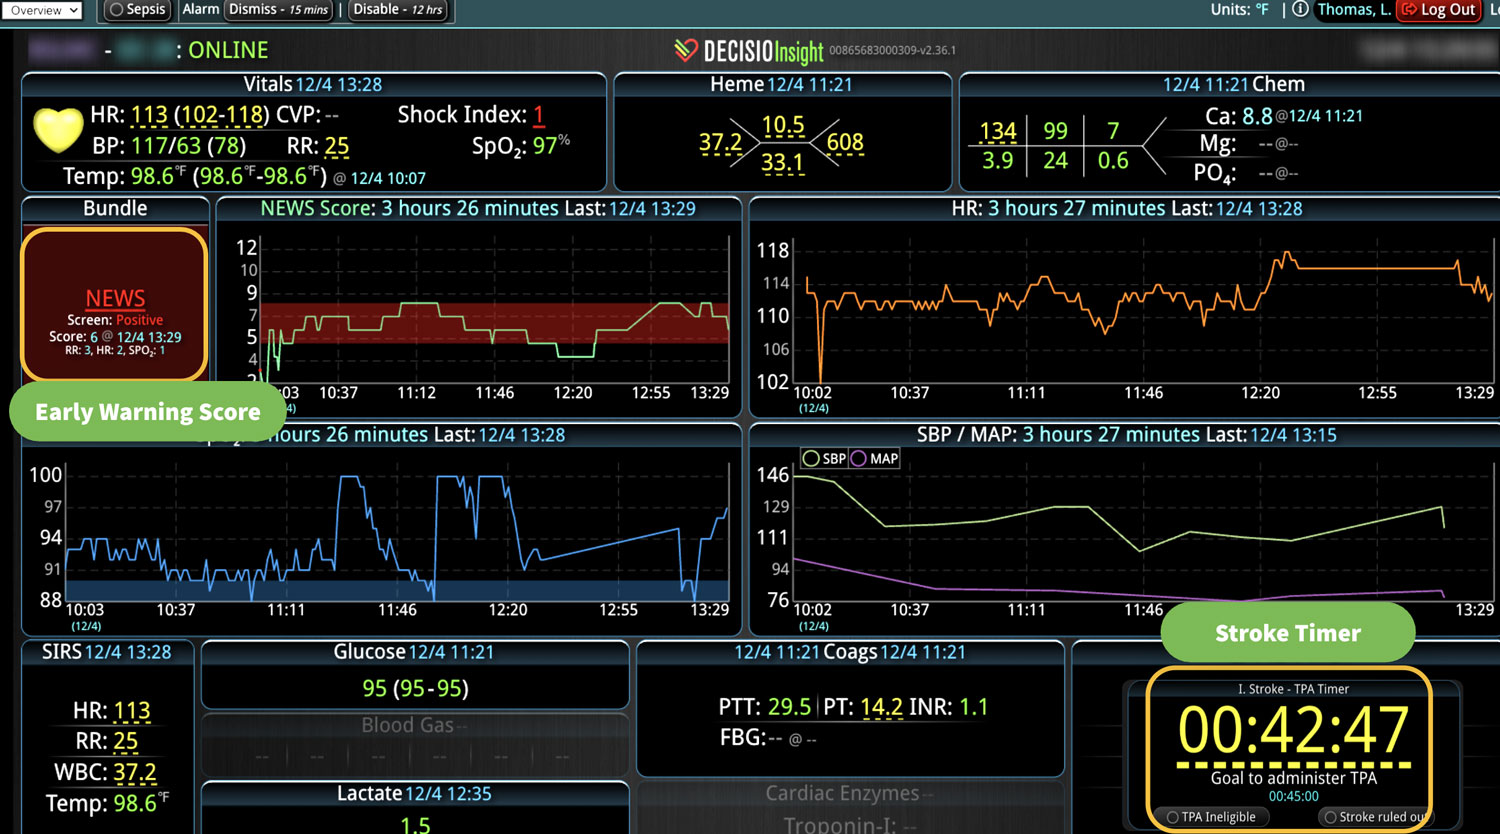
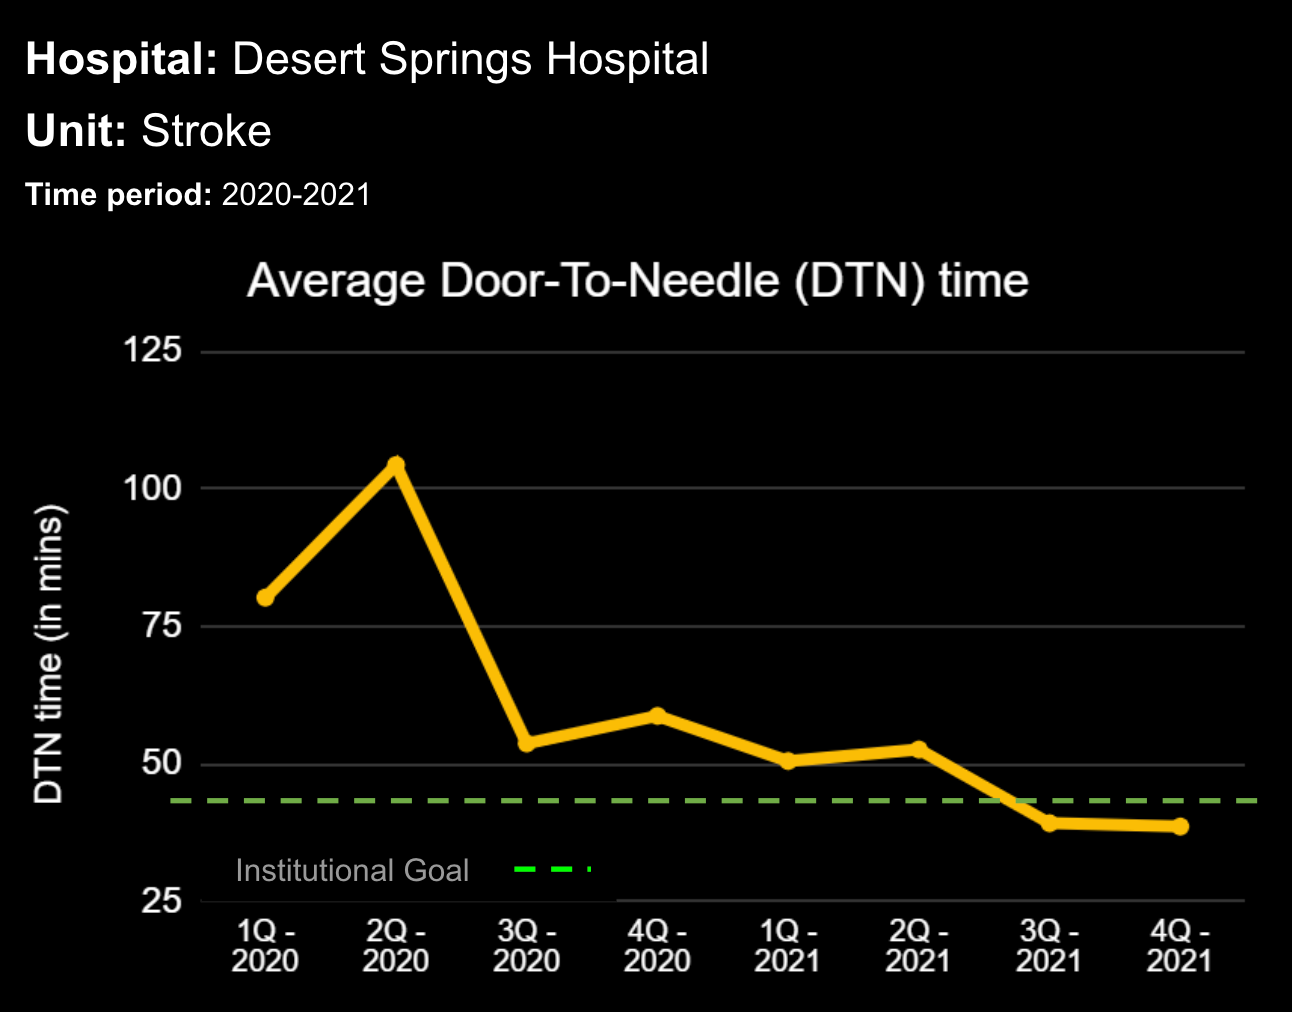
A1. Computerized Clinical Decision Support System Improves Door-To-Needle Time for Acute Ischemic Stroke.
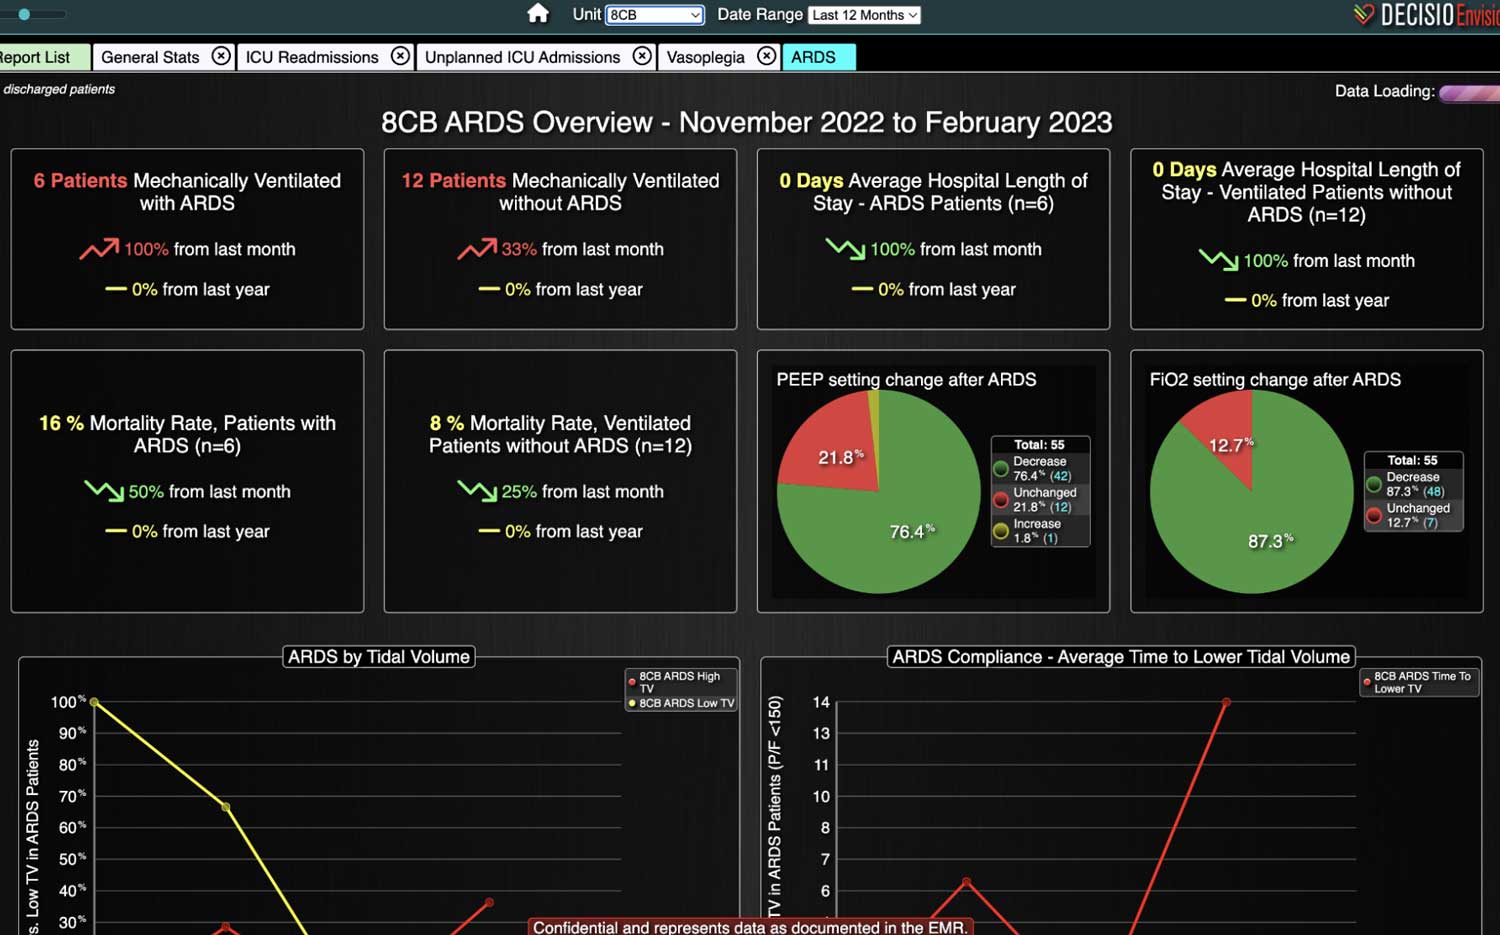
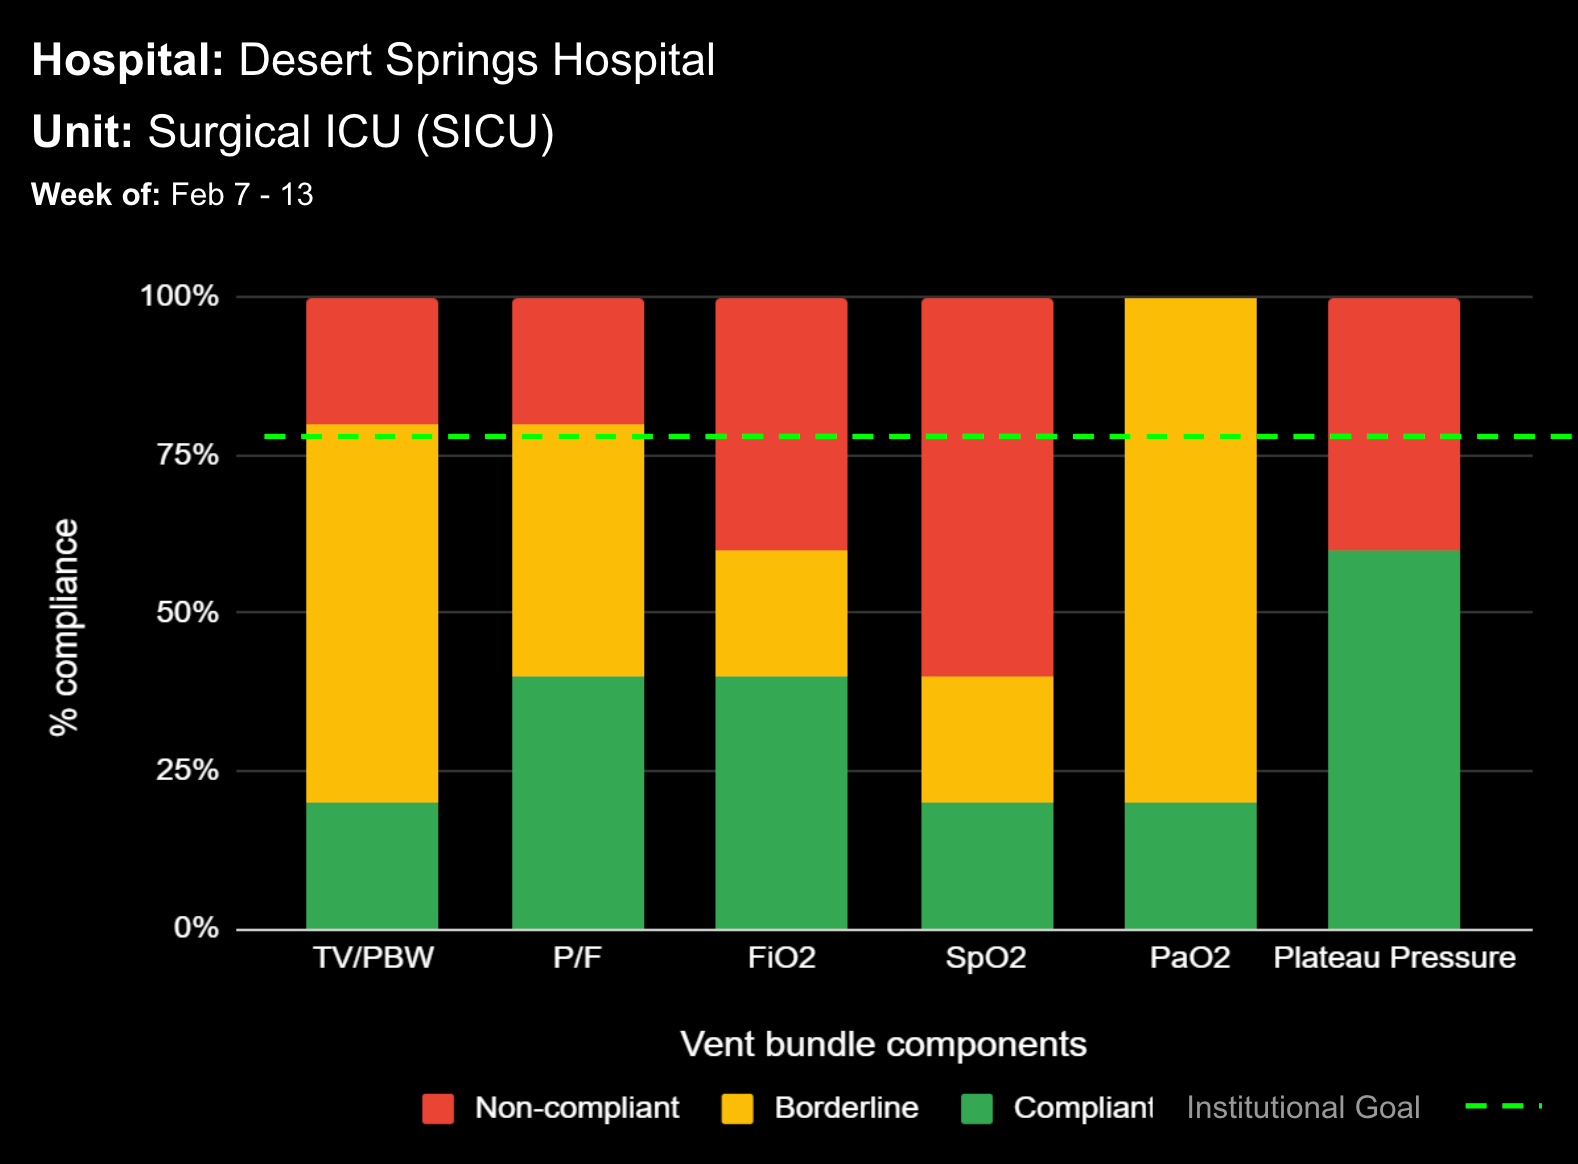
A2. Howard C et. al. Improving Compliance with Low Tidal Volume/Lung Protective Ventilation with Utilization of a Real-Time, Bedside Surveillance and Early Warning Decision Support System; Abstract CHEST. San Antonio, TX 2018.
A3. Baker J et.al. Acute Kidney Injury Reduction after Implementation of an ICU Visual Clinical Decision Support Tool. Poster American Surgical Association; Napa Valley, CA 2018.
Other Sources:
1. Jones D et. al. U of Melbourne, ISRRS. 2019
2. Brown A et. al. Recognition of the critically ill patient and escalation of therapy. Anesthesia & Intensive Care Medicine 2019.
3. AHA, ACLS Provider Handbook, 2015
5. Shafi S, et. al. Compliance with Recommended Care at Trauma Centers: Association with Patient Outcomes. J Am Coll Surg 2014.
6. Duclos G, et. al. Implementation of an electronic checklist in the ICU: Association with improved outcomes. Anaesth Crit Care Pain Med 2018.
15. Modern Healthcare, Sepsis treatment costs shoot up $1.5 billion for hospitals over three years, March 2019
17. Key 2008 CMQCC Hemorrhage Task Force Survey Findings
18. Creanga A A, Syverson C, Seed K, Callaghan W M. Pregnancy-related mortality in the United States, 2011-2013. Obstet Gynecol. 2017;130(02):366–373
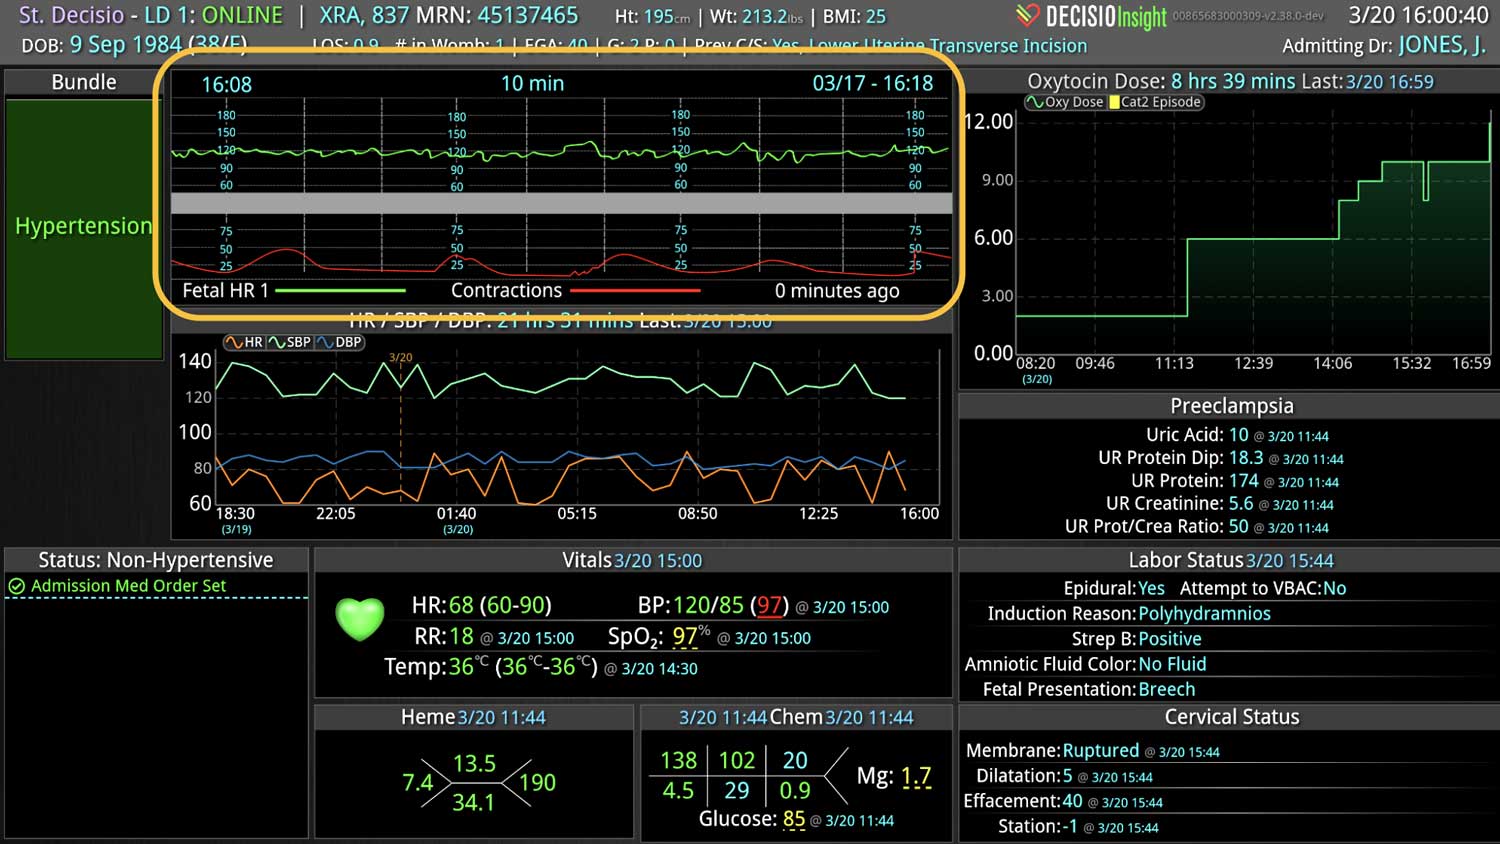
**Indications for Use: DECISIO’s InsightIQ (DECISIO Health Patient Dashboard) is a decision support device indicated for aggregating, displaying, and managing physiologic and other patient information. This information is generated by third party medical devices and patient information systems. The device performs automated calculations on patient data collected by third party devices based on approved clinical protocols at patient care facilities.